Chiral Method Selection: Visualization in Analytical Studio
Compare column–modifier options at a glance with Analytical Studio scatter plots; meet resolution and retention targets in minutes, not hours.
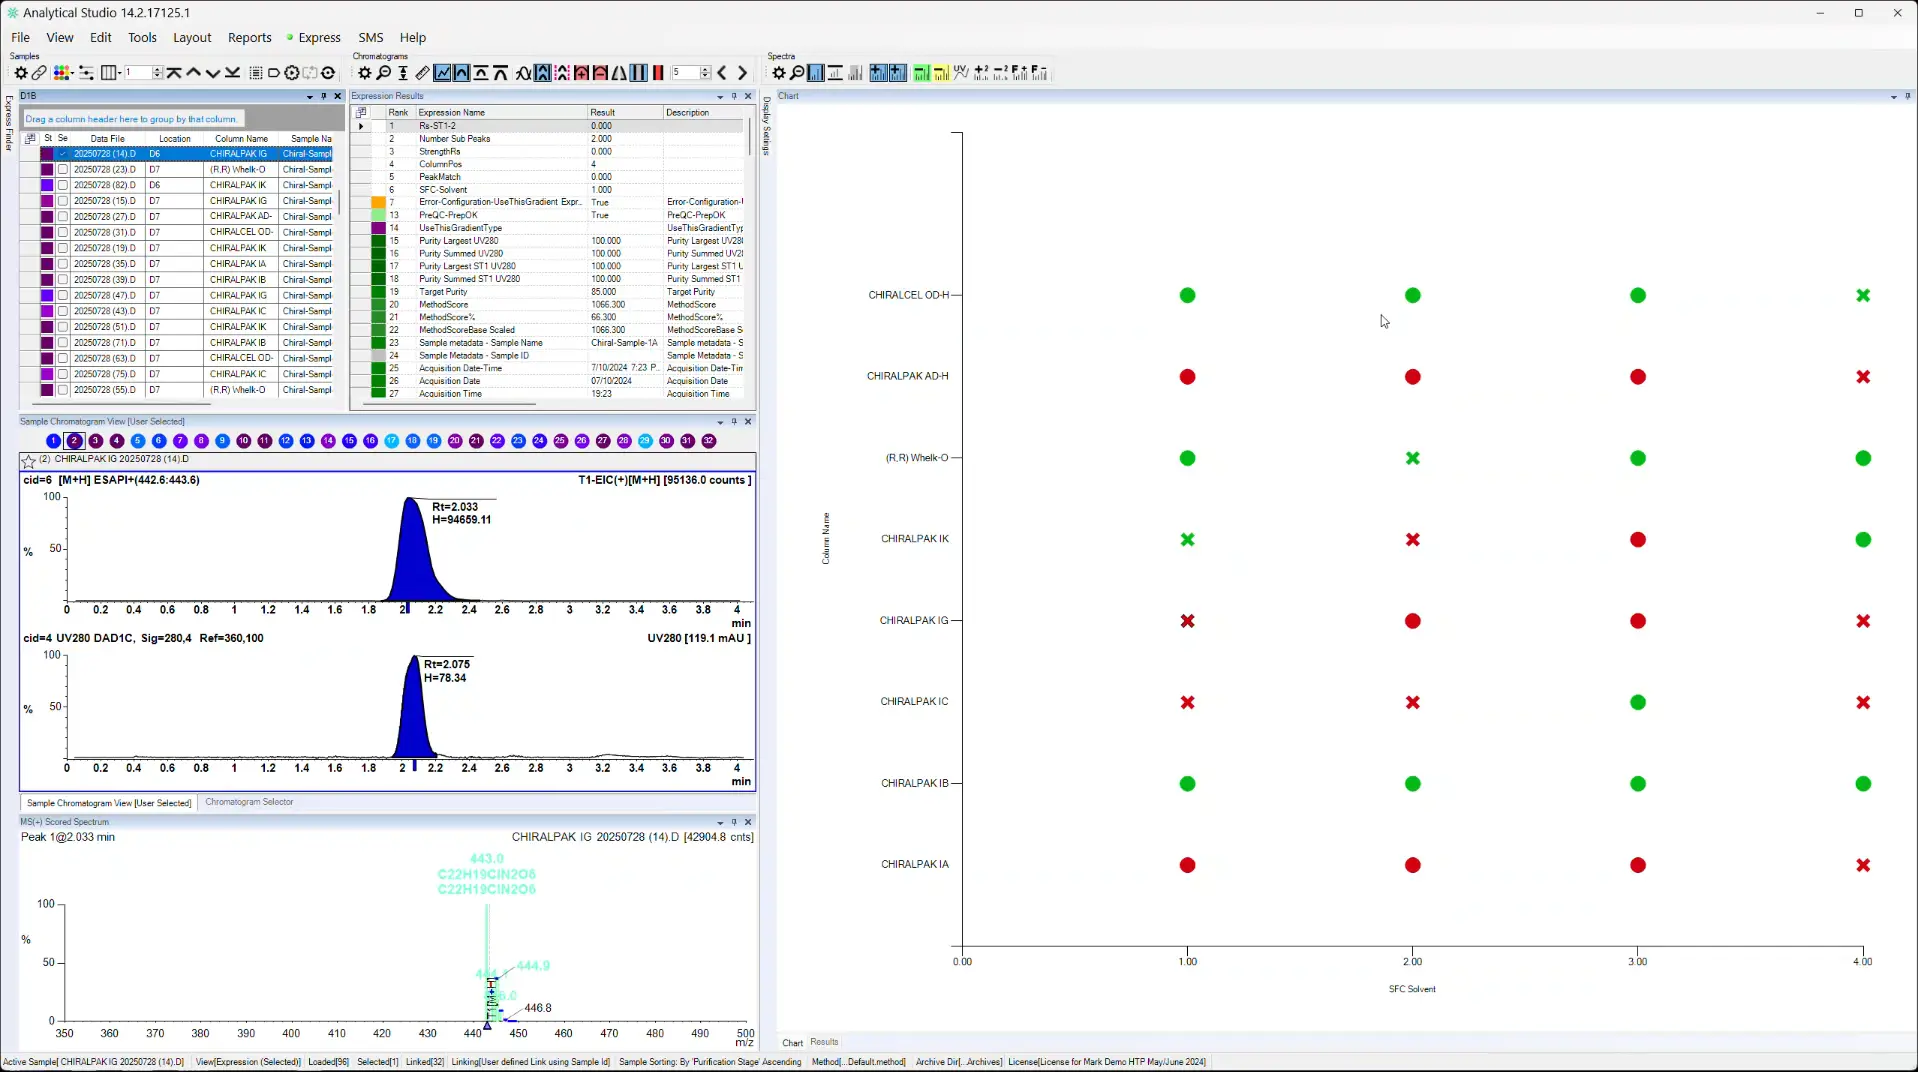
This tech note shows how Analytical Studio turns large chiral SFC-MS screens e.g., three compounds run across eight columns and four modifiers, into an interactive scatter plot so scientists can see winning conditions immediately.
The plot maps modifiers (x) and columns (y), with color encoding resolution thresholds (e.g., Rs ≥ 2.0) and shape encoding retention-time cutoffs (e.g., Rt ≤ 2.0 min); any point clicks through to the chromatogram and mass spectrum for confirmation. Results highlight patterns at a glance guiding fast, defensible choices.
The approach reduces review from hours to minutes while improving consistency, auditability, and reuse of visualization configurations across teams.
Prefer a concise walkthrough? An accompanying video is available alongside the note.
the Resource Success page.”

Additional Resources
Used by companies worldwide
Partner With Us
We partner with you to provide customized informatics solutions that use Analytical Studio to enhance decision making and accelerate your workflows.

